Go back to All About That Bayes
Reducing Research Debt
A few ideas on the use of web technology to present distilled research (while becoming a better teacher in mathematics
With "teacher" meaning here someone who teaches mathematics, i.e. someone writing a paper or a textbook or someone explaining a mathematical issue on a blackboard etc. This article is written from the perspective of a mathematician, but it should be easily translated into physics, computer science and related fields.)
This article should be read as a collection of ideas for reducing research debt in the sense of Chris Olah's and Shan Carter's article (which, in case you have not read, I warmly recommend you do before reading further).
The impossible climb
The last true polymath is said to have been Gottfried Wilhelm Leibniz, with countless contributions to logic, philosophy, mathematics, engineering, psychology, physics, law and various other fields.
Few of us can say to have a similarly broad expertise; even more: Most researchers would label themselves not as mathematicians but as topologists, probabilists or computational scientists; not as physicists,
but as experimental physicists or string theorists etc. Has
mankind become more stupid? Arguably, but another factor is definitely more significant.
If Leibniz's endeavours are likened
to climbing all mountains in the Austrian Alps (which is no mean feat but possible given sufficient fitness and perseverance), a modern scientist aspiring to be a true polymath faces a challenge similar to that of scaling every elevation higher than five hundred meters on Earth as well as on any known celestial object in the solar system.
The large amount of knowledge that humanity has accumulated so far has made it virtually impossible to be an expert in more than one discipline.
This also affects students aspiring to become researchers themselves: The long climb to the peak of current research becomes longer and more tedious with every new result stacked on top of the mountain
of science. Thought through its conclusion, this means that -- given nothing changes -- there is a natural limit to research at a point where coming to speed with current research takes a whole lifetime. All peaks that are higher than that constitute
impossible climbs (and impossible scientific breakthroughs).
There are two ways out of this dilemma. First, we can narrow down specializations even more
such that there is less relevant material to be learned until novel research can be carried out. But this can only buy us so much time and it seems plausible that there is an upper limit to specialization
that will still attract people to scientific research. Also, a forest of disconnected ivory towers not being able to communicate with each other generates its own kind of problems: Techniques which are useful for various disciplines need to be developed
by each discipline separately and multidisciplinary projects will become even more rare. It can be argued that general relativity could only be formulated by collaboration of people who grasped
the physics and the necessary differential geometry.
A second way is to speed up the learning process In the spirit of Christopher Olah's article this means constructing elevators to skip the climb..
In this essay I want to collect and present a few ideas on how to achieve this goal with the aid of newin the sense of "newer than books". media.
While a lot of these ideas have been present for some time, with the development of newer and more flexible web technologies, they are now more easily implemented than ten years ago.
We will talk about the following topics.
- Polya's four steps as a general guideline for mathematical teaching
- Leslie Lamport's idea of hierarchical proof structures
- Visualization, animation, and "Explorable Animations"
- Hierarchical and nonlinear narratives
Polya's four steps
Cairns, Gown and Collins present Polya's four steps to solving a problem in the following way.
Polya's four steps for solving problems
- Understand the problem with examples, diagrams and a careful examination of each of the terms and unknowns in the problem.
- Plan how you intend to solve the problem.
- Execute the planned solution with care.
- Reflect on the result, how it relates to other results and how it might be solved differently.
The authors argue that this method for problem solving can be applied verbatim to learning mathematics; and a teacher of mathematics (or someone writing a textbook or a scientific article) should present her material in a
way that the reader will (maybe unknowingly) follow these four steps.
Translated into the language of teaching mathematics, these four steps can be reformulated.
Polya's four steps for teaching mathematicsThis is for the example of presenting a theorem and its proof. It has to be rephrased slightly for presenting definitions.
- Build intuition about the theorem's implication and the necessity of its prerequisites.
- Sketch the proof, i.e. give an outline of its most core elements.
- Execute the proof in detail.Steps 2 and 3 may be realized by the hierarchical structure described below.
- Reflect on the theorem's use in subsequent theory or in applications, on its versions in more general settings, and on variants of the proof.
A prime example for this is put forward by Jonathan Shewchuk in his paper "An introduction to the Conjugated Gradient Method without the agonizing pain" . This is its abstract:
The Conjugate Gradient Method is the most prominent iterative method for solving sparse systems of linear equations.
Unfortunately, many textbook treatments of the topic are written with neither illustrations nor intuition, and their
victims can be found to this day babbling senselessly in the corners of dusty libraries. For this reason, a deep,
geometric understanding of the method has been reserved for the elite brilliant few who have painstakingly decoded
the mumblings of their forebears. Nevertheless, the Conjugate Gradient Method is a composite of simple, elegant ideas
that almost anyone can understand. Of course, a reader as intelligent as yourself will learn them almost effortlessly.
[...] I have taken pains to make this article easy to read. Sixty-six illustrations are provided. Dense prose is
avoided. Concepts are explained in several different ways. Most equations are coupled with an intuitive interpretation.
The article keeps its promise and truly avoids any agonizing pain, relying on building geometrical intuition to introduce the
concept of conjugated gradients while basically following Polya's four steps: The author first builds intuition why the naive gradient descent is suboptimal and then sketches the basic idea of conjugated gradients.
He proceeds by executing the derivation of the algorithm (still for quadratic forms) and reflects on its version in the setting of nonlinear optimization.Of course, the article is a lot richer than what this four-step corset requires.
It should be noted that the article also has to be mentioned in the section about visualization and animation as its didactical magnificence notably lies in its lavish use of truly revealing figures.
I believe that this four step system as presented in is a helpful guiding concept to keep in mind for the rest of the article.
Reflecting on these principles, I have found that almost all "excellent"by this I mean exceptionally instructive and well-written (in my opinion). textbooks or papers
roughly follow this pattern.
Hierarchical proof structure
In his 2012 paper , Leslie Lamport advocated the introduction of structured proofs in mathematical literature. His basic message was that, while notation
has improved a lot (we now write $x^2 = 4$ instead of "what is the number which has the property of equating four when multiplied by itself?"), the mathematical community's way of writing down proofs was basically trapped in the 17th century.
Lamport proposes to use a hierarchical proof structure. He writes, "When one reads a
sentence in a prose proof, it is often unclear whether the sentence is asserting
a new fact or justifying a previous assertion; and if it asserts a new fact, one
has to read further to see if that fact is supposed to be obviously true or is
about to be proved."
He presents a proof from Spivak's Calculus book and argues that many of the steps in this proof are hard to understand for a first-year calculus
student.For a detailed critique, see .
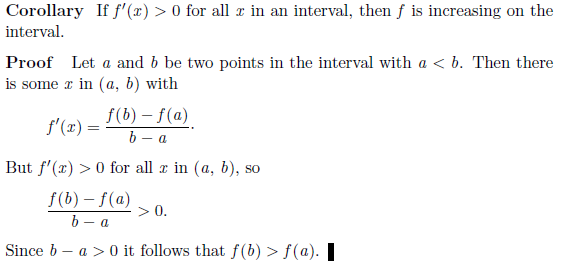 The original proof from Spivak
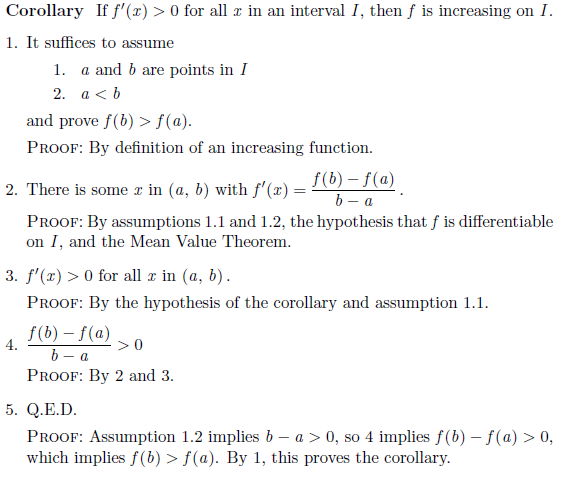 Lamport's proposed proof structure
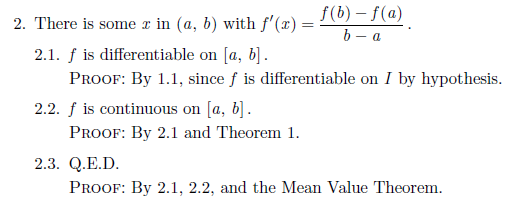
Lamport proposes to structure any proof by introducing sub-steps which are actually sub-proofs and to iterate this subdivision until each sub-sub-proof is trivial. The figure above shows
Lamport's expanded version (on the right hand side). It clearly marks all the "ins and outs" in every step of the proof. Now some reader may struggle with step 2: The application of the Mean Value Theorem
requires a function to be continuous but he only sees a differentiable function. This means we need a sub-proof for the fact that every differentiable function is continous. At this point we can either refer to a lemma
which might have proven this fact before or we can follow Lamport's suggestion to insert a sub-proof:
A hierarchical proof can be implemented in at least three ways.
- Hierarchical structure by indentation: All substeps are always visible and are structured by various degrees of indentation. This is the only viable method for print but has the draw-back of never hiding
unnecessary information for advanced readers (although it is visually possible to skip steps by skipping indentations). This is the method used by Lamport in although he
states that using hypertext (see next bullet point) is even better.
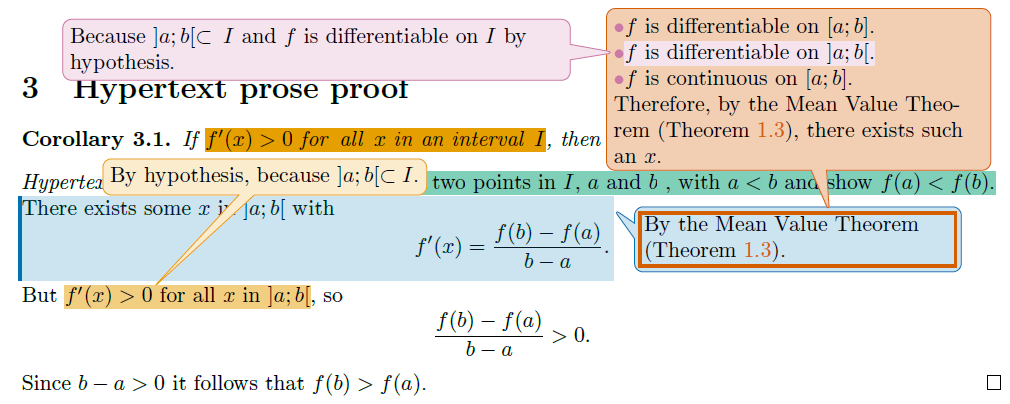
- Hierarchical structure by hypertext pop-ups: Subproofs can be shown by clicking on a proof step. This is the method demonstrated by Moyen
in the figure below and can be used
in pdf files.
- Hierarchical structure by expanding and collapsing text: Clicking on a proof steps pushes down the rest of the text, allocating space for presenting a lower-level subproof.
This is actually the method preferred by both Lamport and Moyen, but can at this point not be realized in pdf files. This is because blank space would need to be allocated in advance,
showing initially a document with huge areas of white space which is only filled if the reader decides to expand the hierarchical structure down to the lowest possible level.
It is possible to realize this in a web-based document, though. This was demonstrated by Cairns, Gow and Collins in
although their interactive topology course sadly no longer exists. To our knowledge this is the only published report of hierarchical structure implemented for a whole set of lecture notes.
It is also a very worthwhile read about mathematical didactic in itself. Given how much web technology has advanced in the last fifteen years it makes sense to revisit their ideas
and realize them with modern web tools. We will talk more about their impulses later. Note also Grundy's description
of a software for "proof browsing".
Here is a demonstration of how an interactive hierarchical structure could work on a webpagePlease do not look at the source code of this example.. Click on grey paragraphs to expand and collapse content.
Corollary: If $f'(x)>0$ for all $x$ in an interval $I$, then $f$ is increasing on $I$.
Proof:
-
-
-
Proof
-
Proof
-
Proof
Visualization, animations and "Explorable Animations"
Mathematical intuition seems to be a contradiction in terms: Intuition is a quick and dirty answering tool shaped by our everday experience: When we show someone a video of a person throwing a ball and we stop the video a
few seconds into the ball's trajectory, we will get a roughly correct answer for "Where will it land?". We have intuition for where a ball thrown by hand will land approximately even without making the calculations.
On the other hand, we don't have intuition for the dynamics of a ball thrown with 90% speed of light because such situations are outside of what we see every day According to what-if, we're lucky in that regard.. By definition, abstract mathematics
lies outside of our immediate everyday experience. Nevertheless, when mathematicians work, one can often hear them say "Intuitively I think you're right, but how do we prove that? Maybe we should try ..., this feels like a good idea.".
The choice of words here betrays that the mathematician actually has some kind of intuition on this topic, not shaped by everyday experience but by hours and hours of "working" with mathematical objects.
Visual explanations
In my experience from mathematics, intuition comes with specific mental imagery: The simplex algorithm for linear optimization problems can be posed in the language of linear
inequalities as a sequence of Gaussian elimination steps. It is a lot more revealing, though, to think of the simplex algorithm geometrically as jumping from vertex to vertex in the polytope of feasibility, always improving
on the value of the objective functional.
Even if there is no actual geometric picture for a specific mathematical concept, there is often a "particularly good" visual way of thinking about it. In many cases, this "good way" is both most
easily expressed and stored in memory when presented visually. This visual representation may or may not be present in the mathematical community but in some cases is not effectively
taught in courses and not explained in most textbooks.
An example for this is conditional entropy and mutual information from information theory. Most textbooks (and Wikipedia) provide with its definition a visual aid in the form of a Venn diagram (see below). But there
is another way by using a specific bar plot. MacKay (Exercise 8.8) argues that the former version is very misleading and the latter picture is much more accurate.
Chris Olah's Visual Information Theory also uses bar plots but most textbooks use the Venn diagram (for example ) or no visualization at all (e.g. )!
For reference, these are the Venn diagram and the bar plot visualization as depicted in
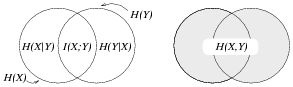
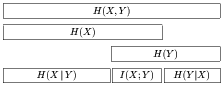
It is important to realize that visual explanations are not just pretty pictures but tools for understanding and building intuition which can lead to a deeper grasp of the concept they convey.
Animations
In some cases, the mathematical objects under study actually are dynamical objects. In this case it is almost negligent to not show animations of their dynamics, albeit it is inevitable
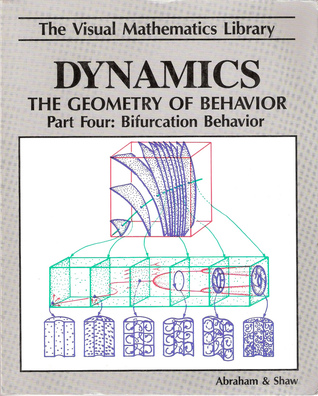
for textbooks and articles presented on paper. There are a few examples pushing the limit of what can be sketched on paper, most notably the wonderful four-part cartoon series Dynamics -- The Geometry of Behavior, explaining
concepts from dynamical systems theory such as periodicity, chaos and bifurcation in an exceptionally revealing and simultaneously mathematically rigoros way. This is even more impressing given the fact that the book
was written before any truly useful visualization software existed and thus solely relied on sketching by hand. Its cover shows one of those marvelous sketches depicting bifurcation behavior of a stirring machine.
As a remarkable example of what can be achieved by switching from traditional paper to dynamical websites as a medium for presenting mathematics, we consider Michael Nielsen's online book
Neural networks and deep learning. It teaches the basics of neural networks, i.e. what neurons are, how backpropagation allows neural networks to learn,
it gives a visual proof on why neural networks are universal emulators and elucidates how "deep" neural networks work. Interspersed throughout the text (which does not shy away from proofs which might lead to a better understanding)
there are wonderful visualizations and animations.
Explorable Explanations
Humans have a deep-rooted passion for playing and exploring, with Friedrich Schiller going as far as to say "Man only plays when in the full meaning of the word he is a man, and he is only completely a man when he plays.".
Just as with many breakthroughs in physics and engineering, many mathematical discoveries only arose from someone thinking "what happens if I change this bit?". People love to tinker and to fiddle; and to observe the environment's reaction.
Fun leads to passion, passion gives persistence and motivation, which in turn is necessary for the hard work needed in order to achieve anything meaningful.
Another facet of the power of playing is that it helps acquiring familiarity and intuition. Why is that? To understand this we need to think about what playing really is: Children play in order to see how things work. When they
knock over a tower of bricks they do not mean to be destructive, they are trying to understand statics and gravity. No parent would try to teach their toddler Newton's laws of motion, because playing is an incredible
shortcut to a kind of understanding which may not be exact, but approximately correct and intuitiveBy this we mean that a child may not be able to calculate the exact point of impact of a thrown ball, but by some age it can
intuitively predict a roughly correct area in which it will land. . Later, when the child learns about mechanics in school, its experience has produced a deep-rooted familiarity and the child can more easily internalize the analytical method of predicting.
While the importance of playing for children and their development has been widely acknowledged, there seems to be a growing body of literature suggesting that adults can benefit a lot from playing, too.
I am no expert in psychology and so we will not get into that. I will just state an unproven proposition: Playing helps people to gain informal and intuitive familiarity with some object or
system which can help them when they are thinking about it in an analytical way. This in turn improves intuition. I think about this feedback system in the following way.
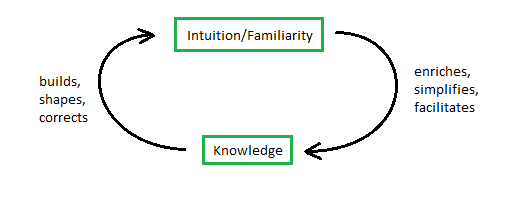
It could be argued that "traditional" ways of presenting mathematics work by entering this feedback cycle from below (starting with knowledge), by confronting the reader with
enormous amounts of facts (definition, definition, definition, lemma, lemma, definition, theorem,...). Only the fittest survive this and emerge -- with an intuition which they formed as a by-productbut
which they may not be able to communicate effectively: They were not introduced into the topic by the use of intuition so they have not learned how to communicate their own intuition.. The collection of ideas in this
section all have in common that they make the reader/student enter the feedback loop from above (i.e. by building some intuition early on).
Entering the feedback loop from above
Let's talk about the game "A slower speed of light" by the MIT Game Lab. The objective is very simple: Pick up 100 orbs by walking around in a slightly Kafkaesque landscape. Every orb you pick up reduces your environment's
speed of light by a small amount (while your own maximum speed is unchanged), until your own speed reaches the speed of light with the 100th orb. By doing that, you can experience step by step relativistic effects: The doppler effect changes the colors of objects,
the searchlight effect brightens objects which lie ahead of you and the whole scenery gets warped by length contraction and time dilation.
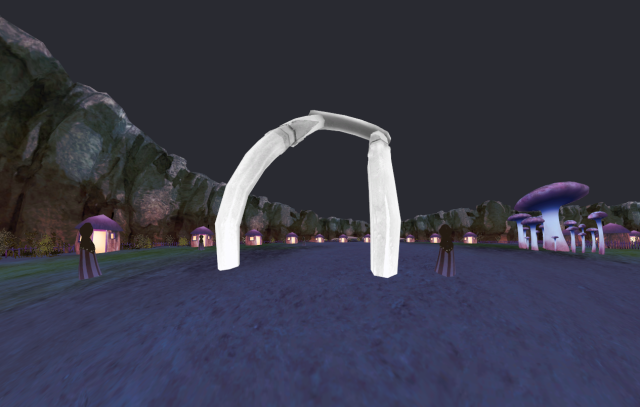
By playing "A slower speed of light" you can get familiarity and almost "real life experience" with something which is classically beyond the reach of our senses. After some time you intuitively know in which direction
the giant mushrooms in the landscape will (seem to) bend when you whizz past them with 90% speed of light. If you decided to calculate length dilation with pencil and paper there is a good chance you would be able to
match the outcome with your newly acquired relativistic intuition and say "Yep, this sounds about right".
Or take the short browser game "District"Its author is part of a community making "Explorable Explanations" .. It shows how to edit voting districts in order to secure your candidate's victory even if the majority of voters is not voting for them. This teaches
the basics of gerrymandering better (and quicker) than reading an article about it could.
There is a community of people trying to teach interesting concepts like the one above in the form of "Explorable Explanations", see this website.
Also, the data visualization community is doing wonders with interactive data presentation. I strongly believe that there could be a lot more
collaboration between scientific researchers and data visualization wizards, aimed at creating graphical explanations of very challenging topics (as in functional analysis or quantum field theory).
Nonlinear and hierarchical narratives
Cairns, Gown and Collins very nicely explain how there are essentially two parameters to tune when writing down math:
- Amount of details in the proof: Lots of details mean that the main idea of the proof might get obscured by technicalities, too few details means the reader cannot properly understand it.
- Amount of contextual informationThis means material outside the classical "lemma, theorem, proof, corollary" structure, i.e. examples, visualizations, explanations, hints at generalizations and applications etc.
. This kind of "bonus material" is essentially irrelevant for the logical argument (and tiresome for an expert in the field just trying to find the main contribution of the text) but is necessary for
a beginner in order to form a better mental representation of the material presented.
Setting those parameters means choosing an audience: There are few textbooks which are read by both undergraduate students and researchers, and indeed, as Cairns, Gown and Collins point out: A given mathematical text
may not even be appropriate for a single reader at different times (with the reader progressing in her mathematical abilities, she may want to see less and less technicalities in the proofs and the general exposition in order to more quickly absorb essential information).
Paper based media necessarily fix these parameters once and for all. The use of "starring" sections (i.e. marking them as advanced material) or relegating technical proofs to the appendix can alleviate the issue, but permanently
skipping large portions of text makes for a tiresome and disorienting read.
With modern web technologies, there are at least two possibilities in order to tackle this problem. First, we can apply the idea of hierarchicalizationas discussed for proof structures above.
and make whole sections of contextual information appear and disappear on the reader's whim. This might work nicely but there is another problem with conventional media:
Textbooks and scientific articles are usually written in a linear, contiguous manner. Theorems and their proofs follow lemmata, after that we get examples, concluded by exercises left to the reader.
The reader can stray from the path, jump over sections and ignore proofs which she deems too tedious to follow for the moment, but she is still forced to navigate her way through what is essentially
a very long scroll of papyrus. If she needs to re-read a previous paragraph or find a definition, she needs to scroll back until she finds the passage. It is hard to navigate in one dimension because
one has to remember the exact order of the items along it. There is another option, though.
Adding dimensionality
We talked about people loving to play and explore and so it makes sense to
try and introduce "explorative fun" any time when teaching mathematics (be it lecturing undergrads or writing a research paper).
There is a caveat to this: Given too much explorative freedom, anyone will be overwhelmed by the amount of choices
You can't just give a high school student Matlab or Octave and tell him to "do numerics" with it.. Also, a teacher (or the author of a textbook) supposedly has a specific learning goal for his audience in mind which he tries to lead the student (or reader) towards to.
There is a growing body of literature suggesting that novice students
do not learn effectively when given too much freedom: Students with small prior knowledge profit most from guided instructional approaches with "worked examples", "process worksheets" and
a presentation of the basic laws and ideas needed. Only later, once the student has acquired enough experience, will they profit more from "unguided instructions" like problem assignments (this is called
the expertise reversal effect, see ).Cf. also the "worked example effect" .
There is a sweet spot (which may be individually different) between the yoke of a very rigid textbook and unhelpful total freedom. I believe that an instructive teaching medium has struck the balance if it
takes the reader by the hand, gently leads her towards helpful ideas, warns her of common misunderstandings but then takes a step back and waits for her to choose the directions in which she wants to proceed:
More rigor, more exercise, more details or more intuition Note that those categories are by no means mutually exclusive in the long term, but for someone starting to learn about a specific field they may be at first..
Instead of just hiding and expanding sections which seem interesting to the reader, it would make for an immersive experience if she could actually "go in different directions", not only figuratively (while still being
constrained to the one-dimensionality of the document), but literally: A classical document (even with dynamically expanding and collapsing sections) is still a continuous scroll
(albeit variable in length).
We can imagine her navigating a tree-like structure, with a stem covering the main story with branches diverting to "building intuition", "generalization to metric spaces", "more examples and counterexamples", "applications to physics" etc.
Most readers will find some of those branches, but not all of them, interesting. By presenting the material in this form, the reader does not need to skip a large number of pages,
losing track of what he read and what he leapt over. As humans usually have a decent way of navigating themselves in two dimensionswe do not use three dimensions like birds do., this seemingly
confusing structure might actually lead to an improved orientational sense inside a documentI have often found myself in a situation where I was looking for a specific definition, remark or proof
which I had read earlier but couldn't remember where exactly it was located. This is not just unnecessary time loss but also breaks concentration.
.
A second reason for "writing a tree" (instead of a scroll) is that dependencies often form a tree structure, see below. Sometimes the reader has a specific goal in mind, i.e. a chapter, algorithm or theorem she wants to
understand. If the document is written tree-like, she can follow the sequence of branches leading to her goal very easily and more intuitively.
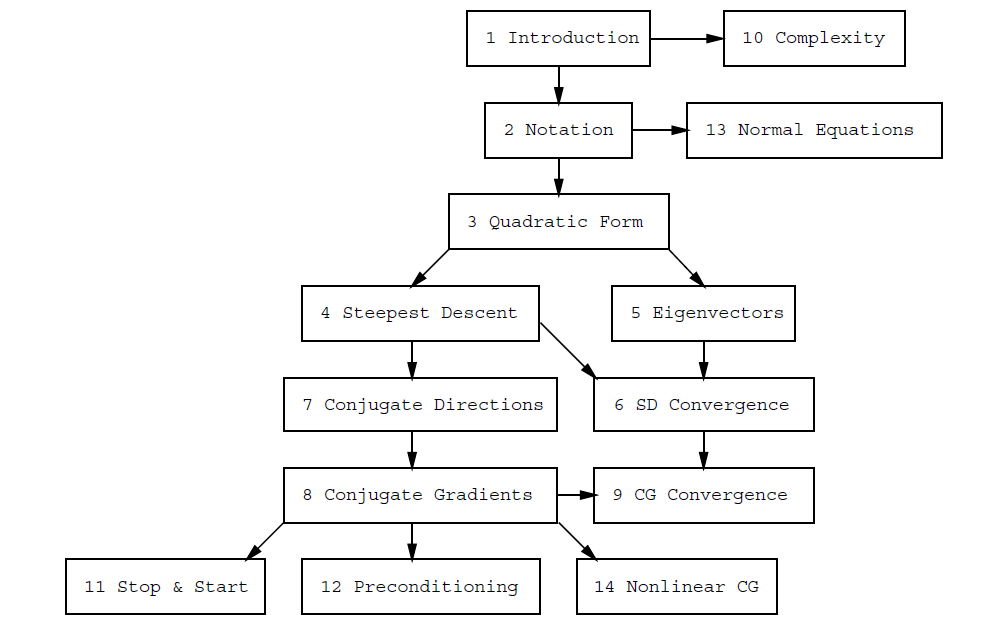
The chapter dependency structure of
Try to recall how many textbooks you have actually read from cover to cover (I suspect that this constitutes a minority). Most readers look for a specific
"substory" of a given textbook (or an article). Let's take a typical linear algebra textbook. Here are a few plausible reader types and their intention for reading it:
- Undergraduate student taking a linear algebra course: She needs to be able to solve linear equations by next week because exams are approaching fast.
- Graduate student: He is currently struggling with functional analysis, has heard that it actually is just "infinite-dimensional linear algebra" and wants to brush up on some basics that he forgot.
- PhD student working in Computer Vision: She is looking for some techniques for working with rotations, translations and general transformations in 3D in order to accelerate her code.
- An assistant professor lecturing linear algebra for the first time: He is currently skimming multiple resources in order to find a particularly nice proof for the Jordan normal form.
- A tenured professor writing her own book about linear algebra: She remembers that a specific notion was exceptionally well-explained in this book and wants to adopt this concept in her own writing.
All those readers superficially need different textbooks because every one of them needs to ignore large portions of the whole text (which is very tiring). It could even be hypothesized that there is such a
large (and growing) number of books on almost any topic because there are typically a lot of different reader types. Few books manage to appeal to all of them and it is exhausting to read a book like this:

A specific reader might read just small, scattered parts (in red) of a book.
A dynamical content textbook where the reader can collapse and expand sections might help bringing those red batches closer together, but a tree-like structure might be more intuitive.
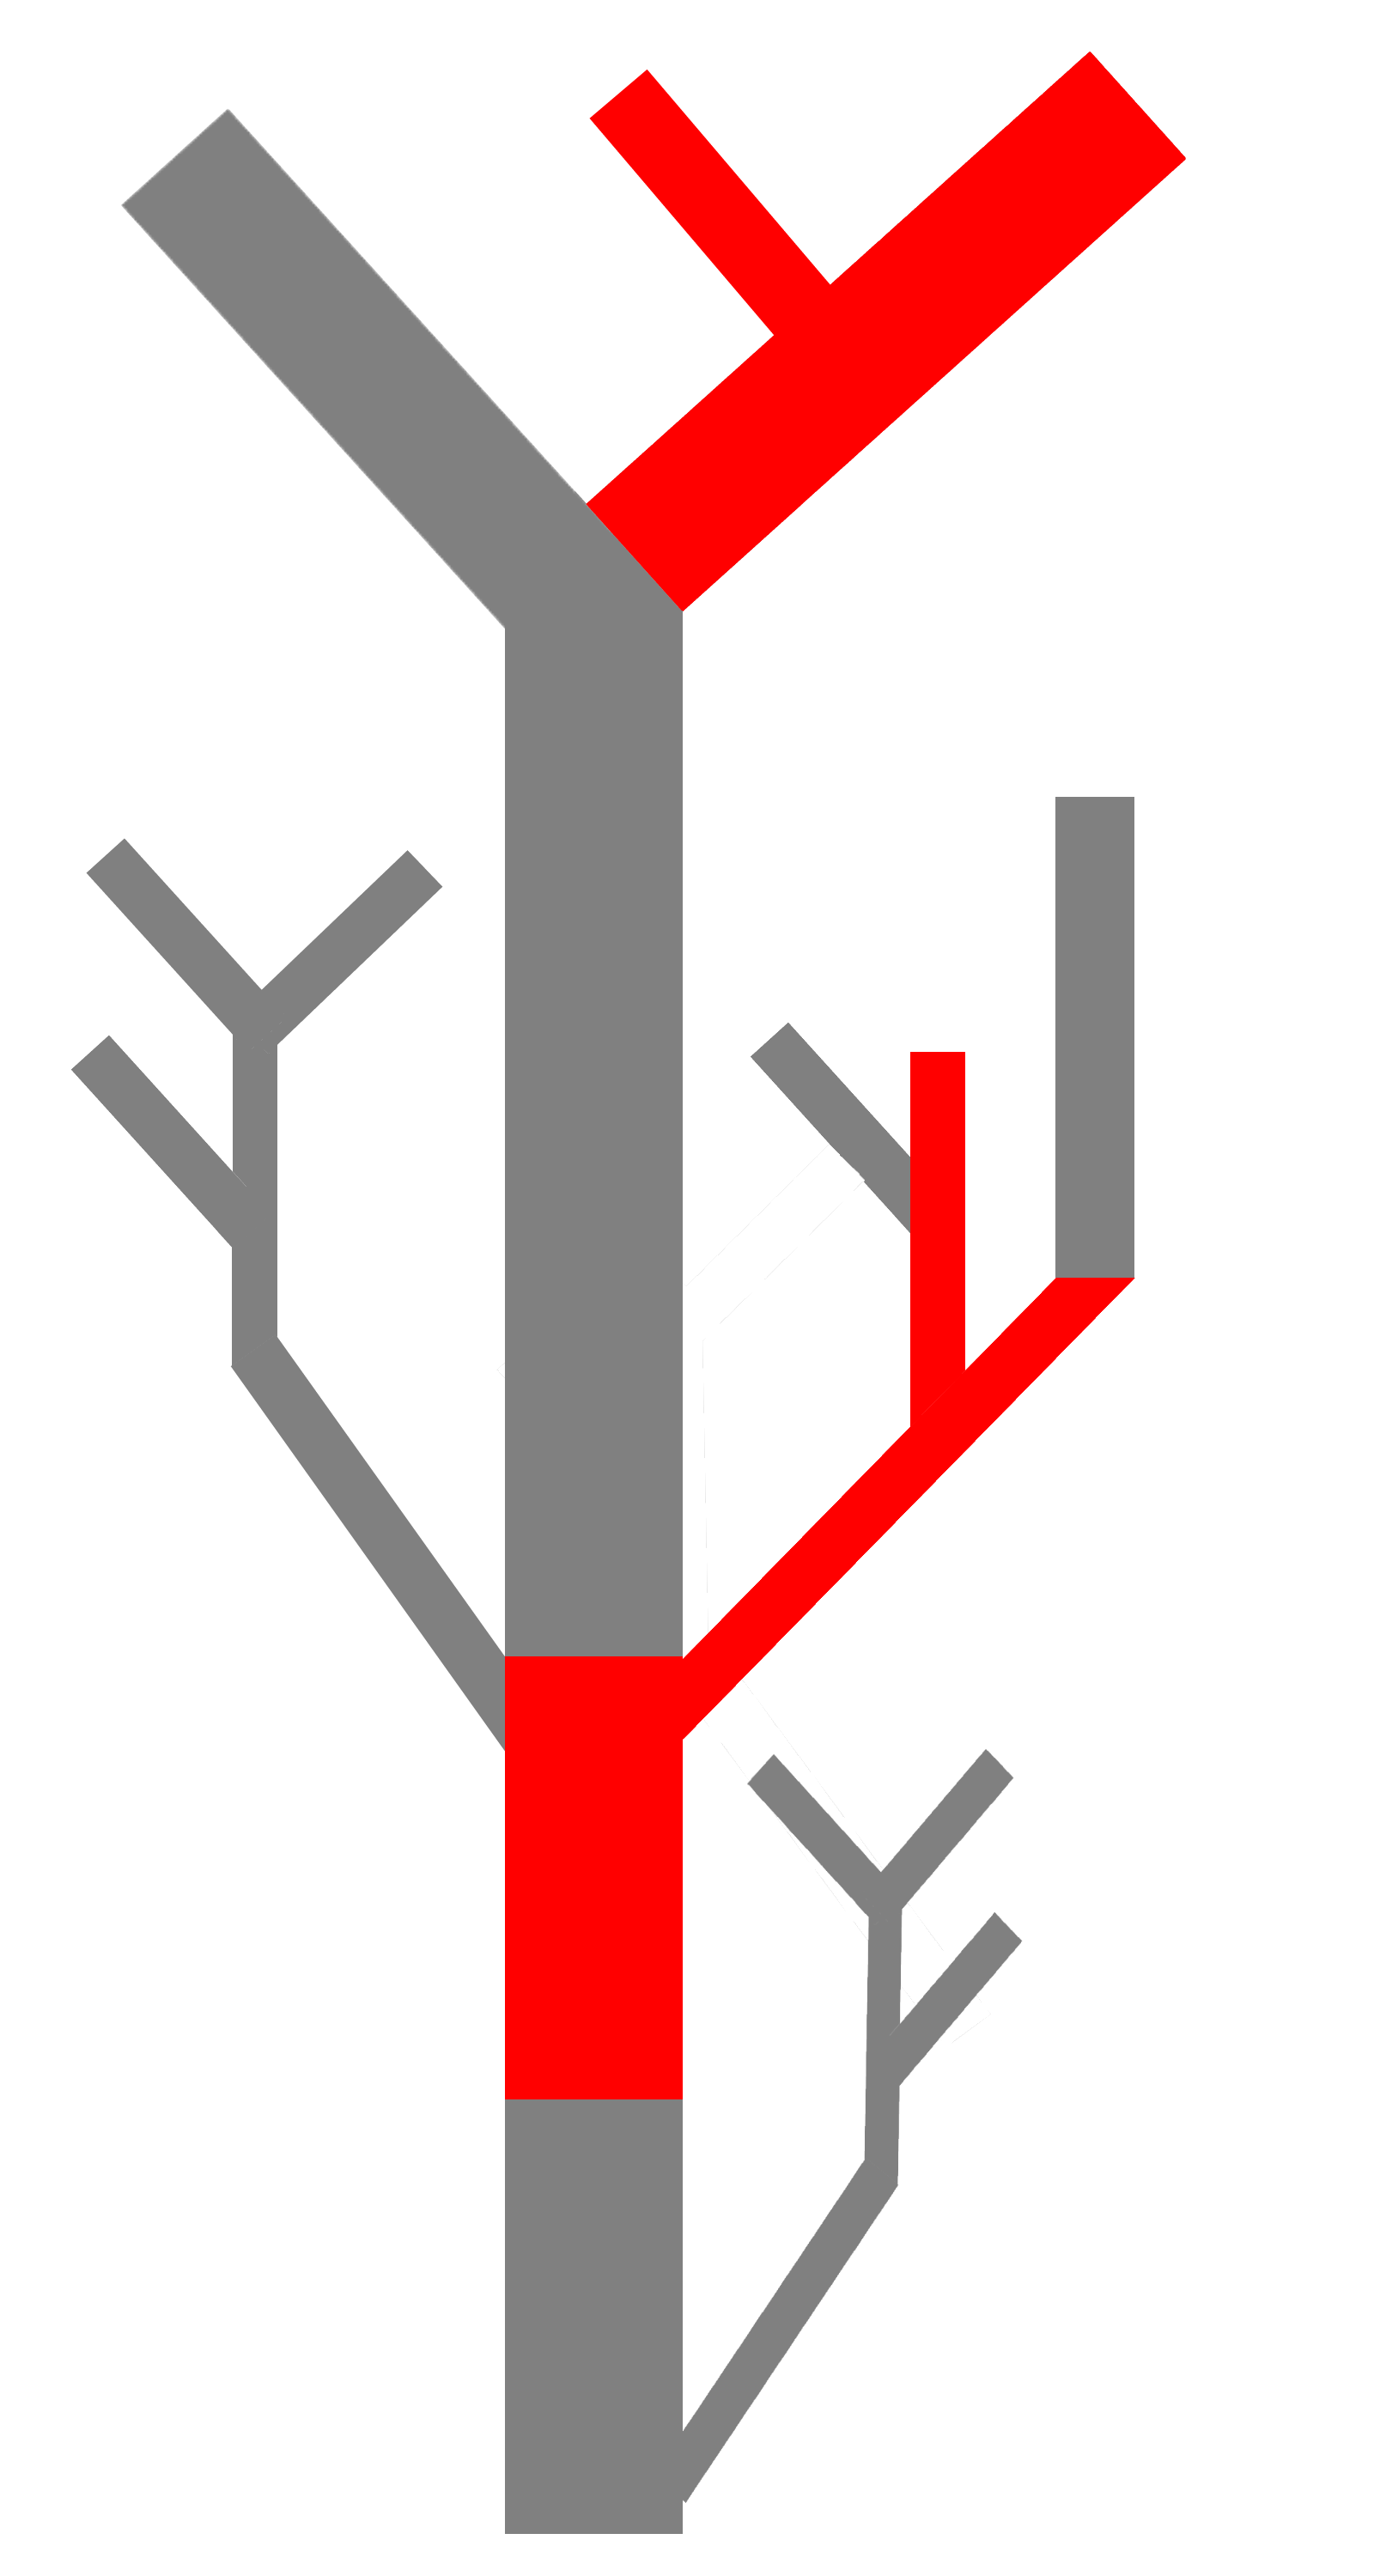
When navigating a "book tree", the reader has a clearer structure of what he is reading and what he is skipping.
It would be interesting to see a scientific article or a textbook which presents its content in such a tree-like manner.
We conclude this article with a short discussion of challenges to the ideas presented.
Hurdles and challenges
- High workload: Most of the methods presented take up much more time than writing a plain traditional (research) article.
- No incentives: There is no real motivator for researchers to take a portion out of their "research time" in order to make their articles more readable (as discussed in ).
- Can't be outsourced: The deep insights of a researcher will most likely be needed in order to improve an article's (or book's) readability in the sense of this article.
- Paper is inflexible: Dynamical hierarchies and animations are hard to publish and make permanent (internet technology gets outdated, servers are shut off etc.)!
- Web technology gets outdated and looks "old" after some time. This is only a minor point as books also get almost unreadable after some time.As knows anyone who has tried to read a textbook written in the era of the typewriter.
- Hierarchical proof structure is not adapted universally well .
Remarks
This manuscript is inspired by articles written by Chris Olah and Shan Carter, and blog posts by Michael Nielsen (see references). I am grateful to Ludwig Schubert for encouraging comments.
If you have questions or comments, please drop me a line at contact[at]pwacker[dot]com. I am indebted to the Distill Journal whose layout I was kindly allowed to use.